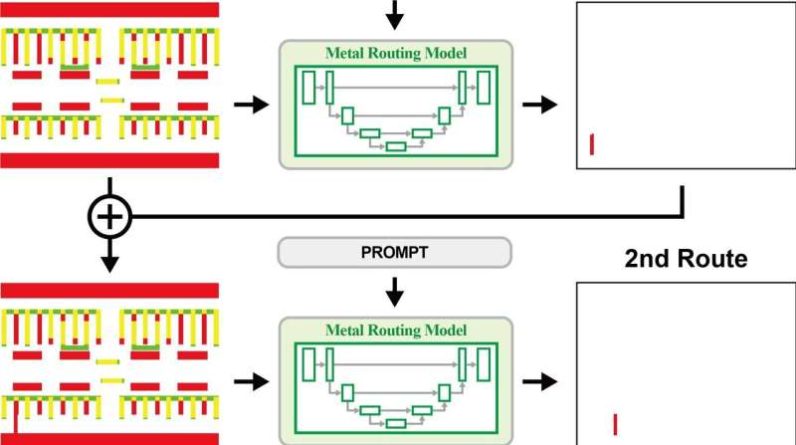
The control can be either manual or automatic, but for automated operations the data van typically runs the operation while the client’s remote location oversees and redesigns the job on the fly, if necessary.
A fully automated system requires a combination of real-time data acquisition, edge device computing, cloud computing, ML and AI tools, and AI-enabled equipment control. Edge-computing control handles routine tasks, but real-time ML learning and feedback is accessed remotely at the client’s office through the cloud, requiring robust, standardized communication and cybersecurity protocols between client and service company. The ML model consumes real-time data to improve frac designs on a stage-by-stage basis, and the AI provides real-time control of the fracturing job based on the revised ML treatment design.
Automatic control can rapidly detect individual pump failure and adjust spread pump performance to compensate. Given a desired treatment rate, the system will adjust each pump’s output to maintain the best distribution of load across the system based on trained ML models for each pump’s performance history. Given the interrogation frequency of the pump sensors, these adjustments are made quickly enough to be transparent to the overall rate output. This feature is also combined with pump operation schedules to determine when a pump needs to be isolated from the system either due to performance degradation below a set standard or for routine maintenance.
Fracture treatment ML development
Early tests of fracture automation were performed in the Bakken by Hess Corp. and Halliburton Co. The project aimed to automatically complete stage treatments using an intelligent fracturing algorithm which employed an ML predictive model to design, optimize, and alter a fracture treatment in real time based on received job data inputs.
The fracture treatment ML-learning algorithm trained on more than 150 wells using historical surface and subsurface data for treated wells and offset wells. Downhole and surface pressures, pumping rates, fiber, and microseismic data comprised the dataset. The model predicted pump-curve response based on the input variables, on a per stage basis, relative to original proposed design. In-well model improvements came from further training of the ML model during the first several stages in the well.
The model contained an optimization feature which designed jobs based on cost, time, rate, or pressure. Boundary conditions such as maximum allowable rate, pressure, slurry concentration etc. constrained the algorithm’s treatment choices.
Field tests combined ML design, real-time diagnostics, and fleet automation. Permanent fiber optic and pressure gauges installed on casing, combined with retrievable fiber optics and surface pressure gauges, provided data input into the system. An initial trial passively ran the model on an initial two wells and on the first 30% of stages in a third and fourth well.
The first two wells ran with the automated fracturing system but without optimized predictive model recommendations. The second two wells ran a check of optimizer adherence to boundary conditions and effective communications between the site supervisor, design engineer, and automated fracturing system operator before unleashing the system in full-autonomous mode.
The goal at this stage of the automated fracturing development was for the system to provide stage designs, control automated equipment during treatment, run the equipment using the predictive model, and consume data for model retraining for the next stage.
The automated system successfully placed fracture treatments. The ML predictive model received operational data and updated completion designs. Most of the updated designs came in time for the next stage. All boundary conditions were honored.
All 20 stages tested the predictive model designs against observed performance. At this early stage the blender was not automatically controlled or remotely monitored by the system and therefore required manual control.
The model designs were all significantly below the maximum allowable pressure boundary and did not use the full advantages of additional pressure. Most likely, large changes in design were required in the model’s optimizer to exceed a boundary condition. Revisions to the optimizer’s tool logic, run-times, and methodology addressed this issue in subsequent trials.
Automated fracturing KPIs
A 2020 automated fracturing study used uniformity index (UI) as a KPI to measure the success of the automated system versus manual fracturing control. This index evaluated flow distribution through clusters based on fiber distributed acoustic sensor (DAS) measurements. It used flow calculated from fiber data at each cluster and provides a value for the distribution of the flow among the clusters (Equation 1).


