 Illustration: Andy Wolber/TechRepublic
Google Bard can help you create content and calculations for Google Sheets. In the first role, Bard serves as a smart list generator that produces content in a table for you to export to a Google Sheet. In the latter role, Bard’s responses help you devise Google Sheets formulas and functions. These uses of Bard offer capabilities that extend beyond the standard autofill and correction capabilities in Google Sheets.
SEE: ChatGPT vs Google Bard (2023): An in-depth comparison (TechRepublic)
For the actions below, you’ll need to be signed in to an active Google account authorized to use both Google Sheets and Google Bard. If you use a Google Workspace account for work or school, you may need to contact an administrator to request access to Bard. Once you have access, open Bard in any modern browser to get started. Enter a natural language prompt, and Bard will provide a response. Bard responses may differ — two people who enter the same prompt may not receive the same response.
Jump to:
How to obtain content from Bard for a Google Sheet
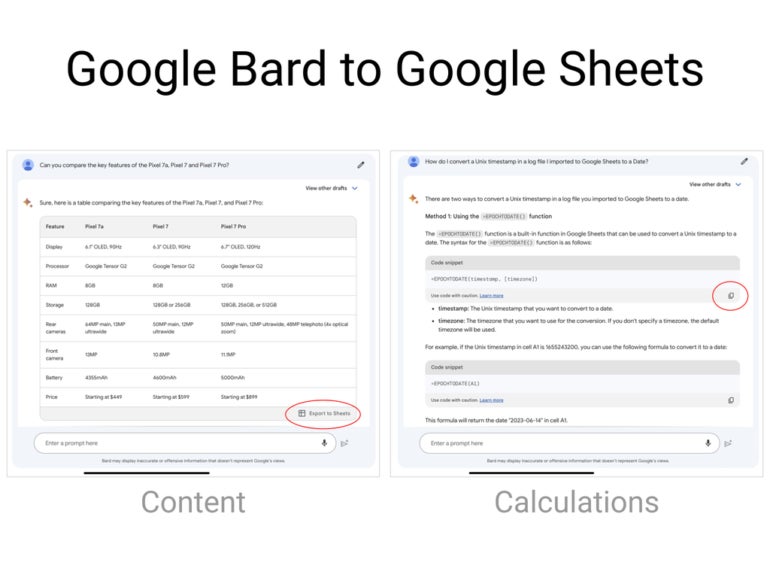
With Bard, you can prompt the system for all sorts of comparisons and lists. For example, a request to compare two or more products might produce a table with a column for each product and each row with a different compared feature (Figure A). You might also prompt Bard for lists of things, such as people, places or things. Since Bard accepts sequences, you might first prompt:
List the 10 cities in the United States with the most annual rainfall.
Then, after you receive the initial response, prompt again with:
Add a column for the population.
Figure A
 Bard can help you quickly obtain all sorts of comparisons and lists. When Bard provides a response in a table, select Export To Sheets to create a new Google Sheet with the table contents.
The tables Bard can generate as a response vary much more than conventional autocomplete sequences available in Google Sheets with the Tools | Autocomplete | Enable Autocomplete Option enabled.
In Google Sheets, you enter a predictable series of alphabetical letters, numbers, days of the week, months or other standard patterns in two or more cells. Then select the cells and select-and-extend the corner of the box to cover the entire range of to-be-filled cells. For example, if you type Mon in one cell and Tue in an adjacent cell, you may select those two cells and then drag the dot to fill another five cells with the remaining respective three-character descriptions of days of the week in English. In contrast, the tables you can prompt Bard to create may comprise a much wider range of listable data.
Choose Export To Sheets
When a response includes a table, select the Export To Sheets option at the lower-right corner of the table. This exports the table to a new Google Sheet (Figure A). The system will use your prompt as both the name of the newly created file and the initial sheet within the file. The contents of the table will be placed in the cells of the sheet, with the titles of the columns in Row A.
Prompt “in a table”
Bard will often automatically format comparisons and lists in a table. When the system doesn’t do this, add the phrase “in a table” to your request. This would make the prompt listed above to be:
In a table, list the 20 cities in the United States with the most annual rainfall.
View other drafts or reset chat
Sometimes Bard provides either a partial response or an oddly formatted response. For example, try the prompt:
List all 50 U.S. states sorted by population.
Bard returned a table of 40 states, which is an incomplete response. In another example, a prompt for a:
List of elements by name and atomic weight
In response, Bard produced a list formatted as a code snippet, not a table. When a response isn’t what you expect, select the View Other Drafts button to access alternative drafts (Figure B). In some cases, one of those drafts will be formatted as a table rather than a code snippet.
Another option when this sort of error occurs is to select the Reset Chat button (as shown in Figure B on the upper left) and then try the prompt again. This may result in a more complete or better-formatted response.
Figure B
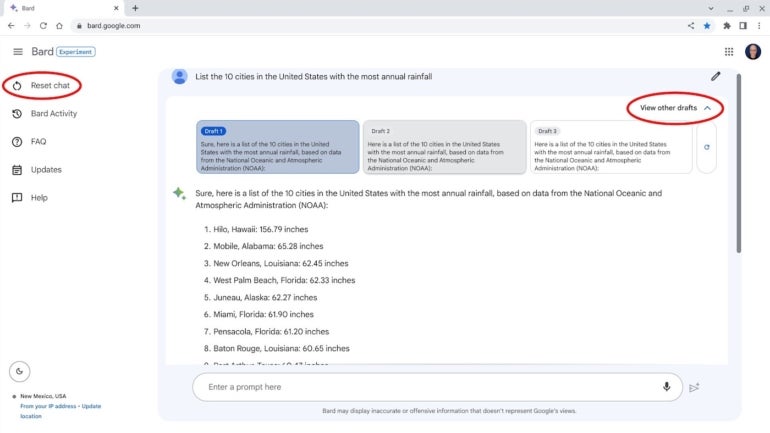 View other drafts to access alternatively formatted responses, which sometimes display data in a table rather than a list format. In some cases, selecting Reset Chat and trying your prompt again may return a response in the format you want.
How to get help from Bard with a Google Sheets calculation
You may prompt Bard to explain and provide examples of Google Sheets formulas and functions. Unlike Google Sheets help pages, which provide details and a static set of examples, you may ask Bard for a variety of examples, along with a detailed description of how a feature works.
For example, if you want to learn a bit more about one of the new functions Google added to Sheets in March 2023, you might prompt:
How do I use the WRAPCOLS function in a Google Sheet? Can you give an example of how I might use it to group a list of employee names into groups of 4 people each?
The response from Bard (Figure C) included, in sequence:
- A description of how the function is used
- A code snippet example of the syntax with each part listed
- A sample formula to group a list into a set of four
- An example with demo names
- Additional code examples to group a list into sets of three, five or seven
Figure C
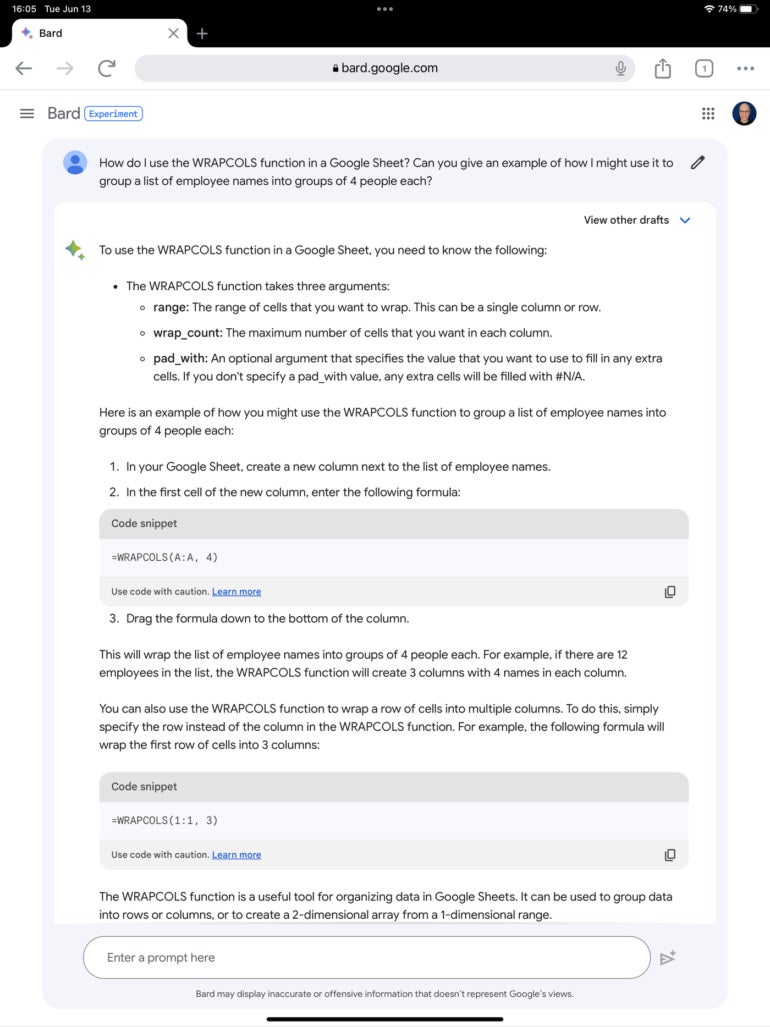 Not only can Bard explain Google Sheets functions, but it can also offer examples of how the function might be used.
To explore additional Google Sheets functions, you might then prompt:
Are there other Google Sheets functions that achieve something similar?
Bard tends to offer a few other functions that help with related aspects of your initial task.
In addition, Bard can help you create the exact formula you need, but it may be a bit of a process of trial and error. For example, say you want to analyze weather data to identify how many days the wind was predominantly from the west. First, try an initial detailed prompt (Figure D).
I have a Google Sheet with data in cells F2 through F367. The data is all numbers, from 0 to 359, and represents wind direction, with 0 being the north and 270 being the west. I would like a formula to indicate the percentage of days that the wind is from the west, where the value is anywhere between 240 and 270 degrees. Can you provide that?
Figure D
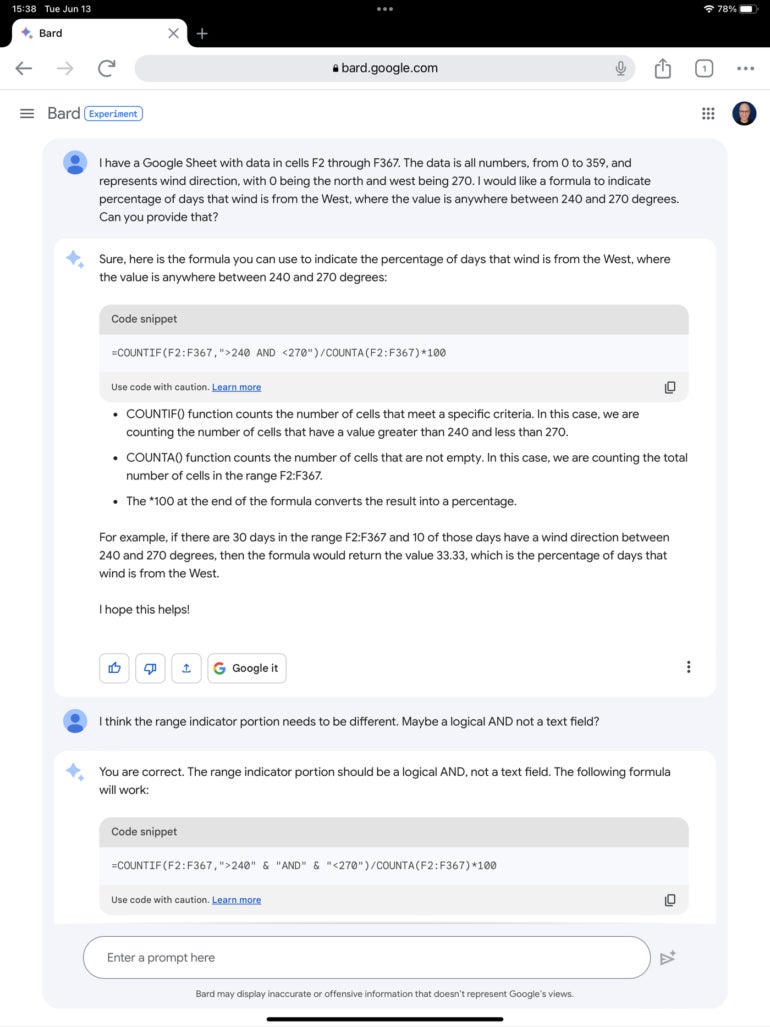 With a sufficiently detailed prompt, Bard can respond with a detailed code snippet that contains a Google Sheets function. While not necessarily always accurate, this snippet can often serve as the basis for the precise formula you want.
The response returned an =COUNTIF formula that threw an error. After a quick review of the function, prompt again, essentially asking Bard to try again:
I think the range indicator portion needs to be different. Maybe a logical AND not a text field?
This time, the response included a =COUNTIFS formula. Select the Copy Code button, switch to the Google Sheet, navigate to the intended destination cell and then choose Edit | Paste to add the formula. This time, with a bit of tweaking, the code snippet worked as desired (Figure E).
Figure E
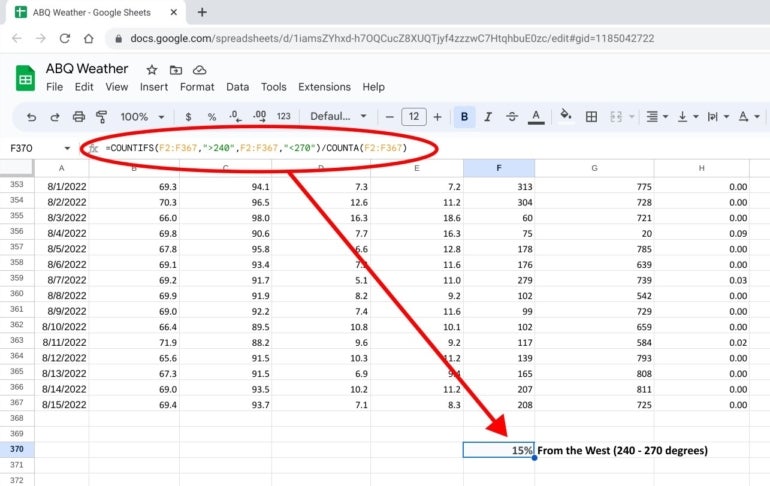 With minor tweaks, the code snippet response provided by Bard delivered the desired calculation.
And that’s a good snapshot of how you need to work with Bard. If the initial response meets your needs, that’s great! But always take the time to check the results for accuracy and be prepared to prompt again — and prompt differently — to evoke a more relevant, useful or accurate response.


